From Homework Assignment to Low-Latency Benchmarking Engine
Debriefing + Intro Optimization
What started as a simple Monte Carlo simulation project for my systems programming class, turned into a rabbit hole of exploring low latency optimization techniques. My professor had us simply optimize by dynamically allocating memory for multi-threading. I decided to go the extra mile, both for the sake of fun and also learning. I used techniques from both my experience and also from companies and frameworks that live and breathe optimization such as Hudson River Trading, Meta, Pytorch and more! Let's start with what exactly my homework assignment was.
The assignment itself was very simple, generate 2 random numbers, \(X ~ \& ~ Y\), where \(0.0 \le X ,Y \le 1.0\). This becomes our individual "dart throw" or trial, giving us a coordinate \(X ~ \& ~ Y\). We would then compute the distance of (X,Y) and check if it's within the Unit Circle's 1st quadrant like so:
\[ \sqrt{ x^{2} + y^{2} } \le 1.0 \]
However, taking the square root is expensive, so we save a couple CPU cycles, ~18 as a rough estimate, by simplifying our equation, via squaring both sides of our equation to get:
\[ x^2 + y^2 \le 1.0 \]
Now ~18 CPU cycles sounds very small, but when running 10M trials in our homework assignment, this expense adds up, even more so when each simulation was running 1 trillion trials in the optimized version.
When \( x^2 + y^2 \le 1.0 \), this means we ended up "throwing a dart" inside the Unit Circle's 1st Quadrant. Therefore, the trial succeeded in a successful dart throw and we add that to hits, an integer initialized with 0. From there we divide \( hits / N \) , where \( N \) is the amount of trials we run per simulation. This gives us the percent of darts that land inside the 1st Quadrant, which we then multiply by 4 to get our rough estimate of \( \pi \).
Before we go even further, yes this entire blog post is about me going way beyond overkill to optimize HW 8. In fact, that's the exact mindset I went into upon taking this project, I quite literally treated it like I was building high frequency trading infrastructure, or at least my imagination of what it would be like. Now, make sure to bring out a pillow in case you fall asleep, because this is where the rigor starts to pick up!
Note: CPU cycle counts are based on my AMD Zen 4 micro-architecture, so rough estimates are used for CPU cycles, for accuracy please refer to:
https://www.agner.org/optimize/instruction_tables.pdf
Pre-allocating Memory & Bump Allocator
Originally and as aforementioned, my professor had the class optimize the sequential via multi threading on dynamic memory, which we will call heap-allocated memory from now on. My first approach of optimizing was a bump allocator memory pool, avoiding costs of repeated malloc / free operations by pre-allocating a large buffer and using pointer arithmetic to walk the memory pools' addresses. Beyond faster allocation, I also aimed to enforce strong cache locality, alignment for SIMD-safe alignment, and \( O(1) \) bulk deallocation via simple resets, instead of relying on the GC (garbage collector).
I got the idea of using pre-allocation from LMAX Group's Disruptor, an inter-thread messaging library. They employed a "pre-allocated data structure in the form of a ring buffer." Meaning that all memory for the ring buffer is "pre-allocated on start up." Hudson River Trading also had a similar approach, using a pre-allocated pool to allow effective usage of huge pages. Another inspiration came from Meta's open sourced C++ library, folly::arena, a bump allocator for high-performance, short-lived memory allocation.
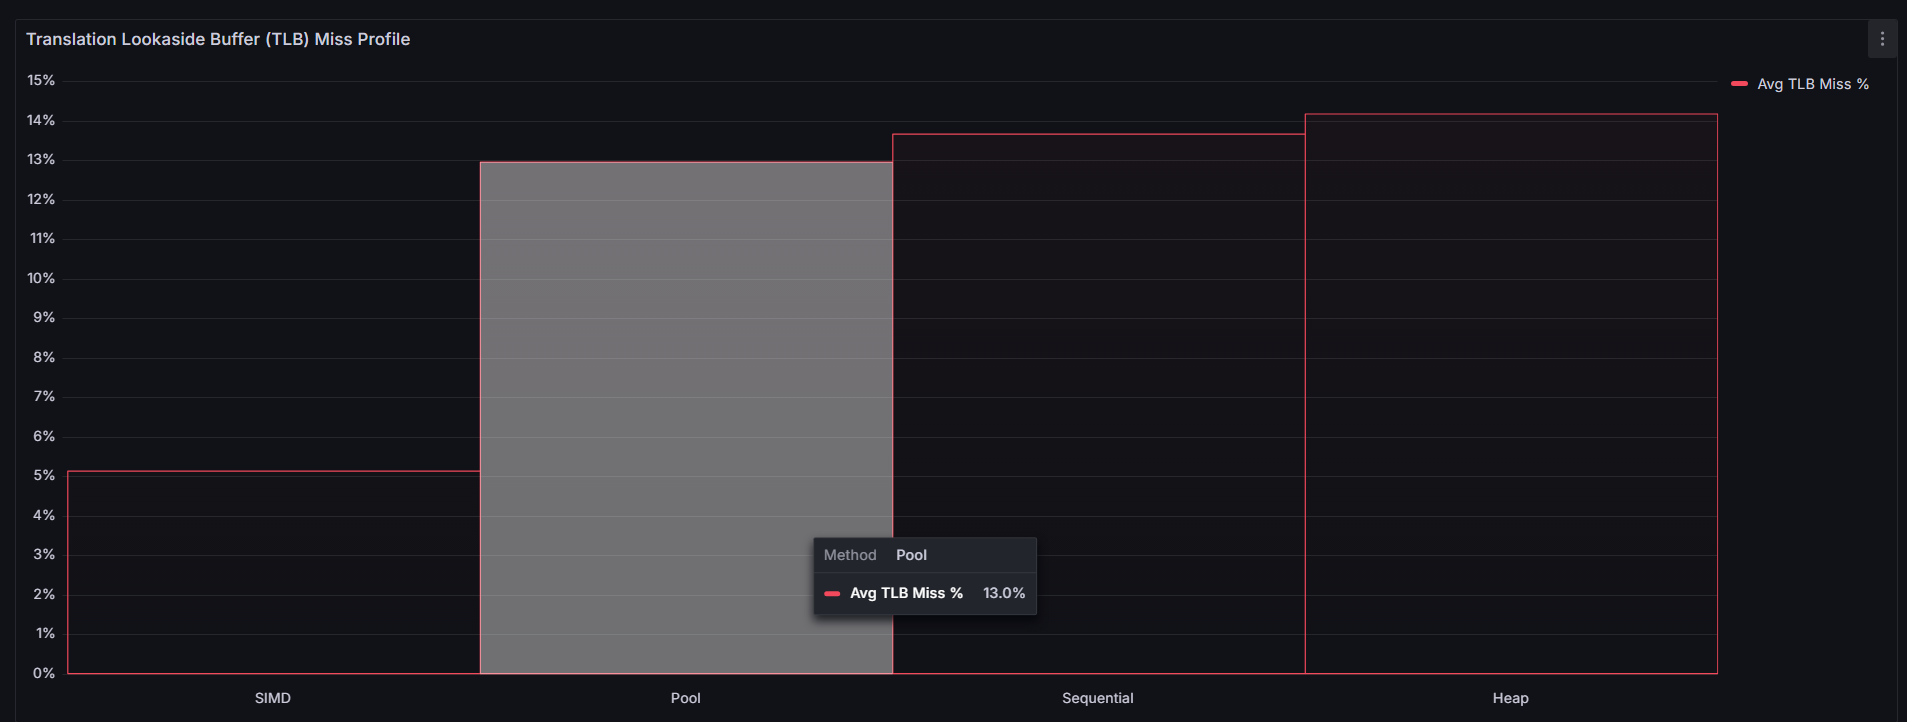
I quickly learned from benchmarking, that this was not the case. I suspected it was because I'm working with primitive types, but upon seeing that I had worse cache miss rates with my bump allocator than compared to dynamic memory, I must have had implemented something wrong. Which I will fix in the upcoming days, but it's most likely due to a byte alignment or pointer math issue. This was part of the goal of benchmarking various approaches to estimating \( \pi \), not just each method's effectiveness but also finding anomalies in my code. I knew something was wrong if I was getting \( 28% \) cache miss rates using a bump allocator. However, as I dived deeper, I noticed that despite the higher cache miss rates, my L1 cache & TLB miss rates were lower compared to the heap allocated memory approach:
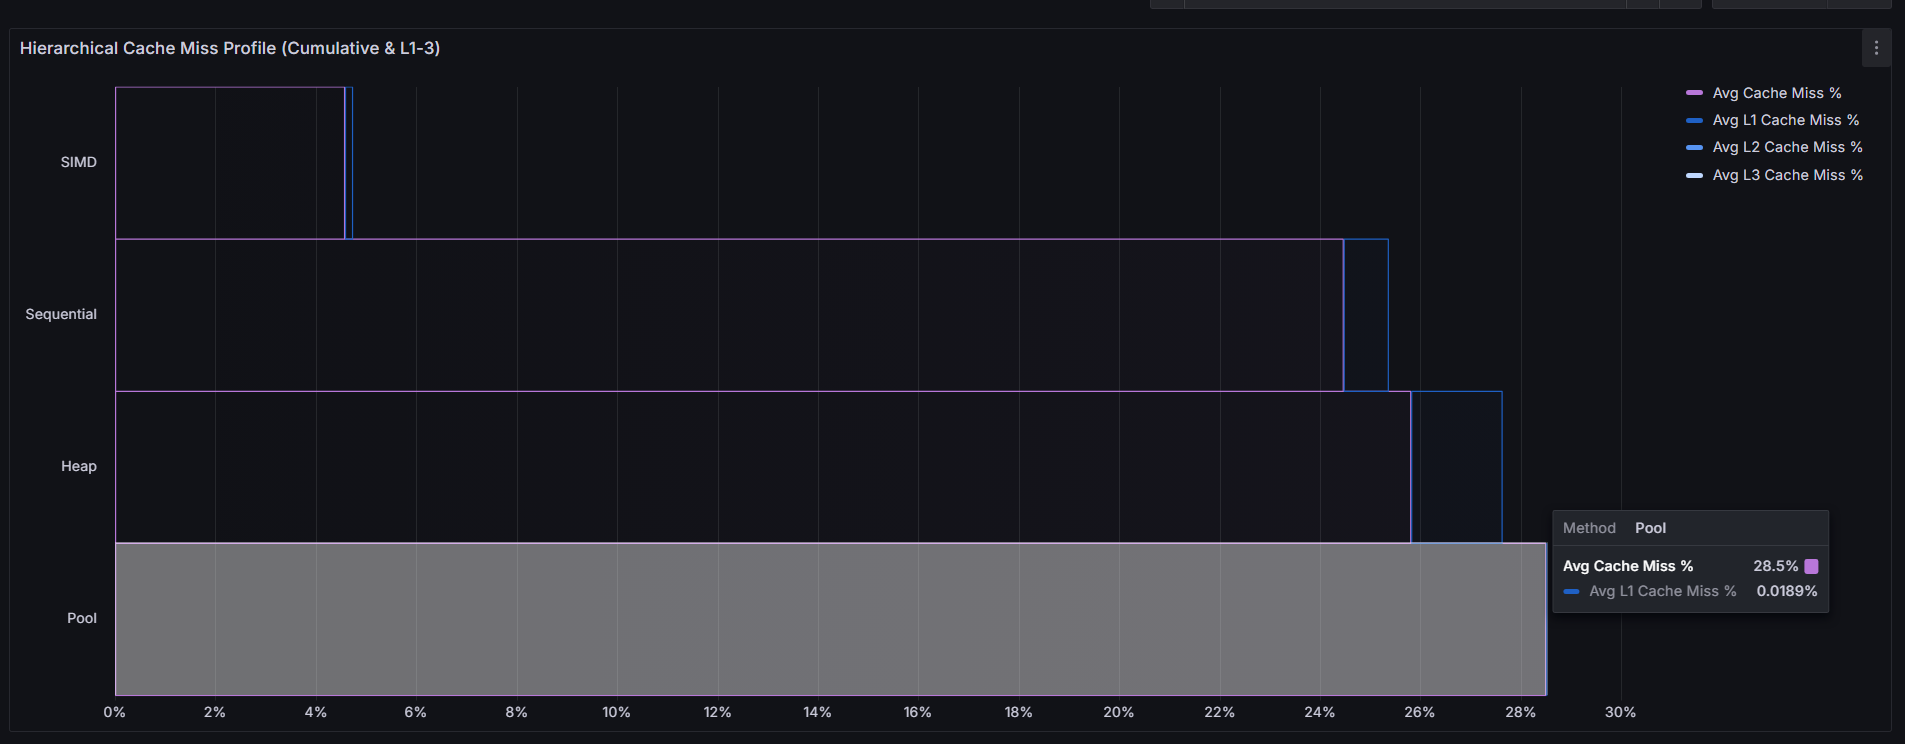
This led to my hypothesis that my bump allocator's cache misses were mostly coming from downstream. Then, I concluded that over-aligning 8-byte doubles to 64-byte boundaries wastes cache lines. Although L1 cache hit rates improved, it came at the cost of significantly higher pressure on L2, L3, and RAM, suggesting that my allocations were overwhelming L1 and spilling inefficiently down the cache hierarchy.
Since each allocated double costed an entire cache line rather than sharing one, L1 ends up getting filled fast with bloat. Thus values are evicted and waterfalled down the cache pipeline: L1 ➤ L2 ➤ L3 ➤ Ram, thus increasing the higher amount of cache misses past L1. So it seems that L1 became so overwhelmed, it started dumping its work onto the lower cache levels. It seems that each cache line is never re-used since it's packed with 1 value, thus L1 cache misses are lower but the cache lines end up waterfalling down the cache. Which is where most of the cache misses seem to be happening. I will have to incorporate deeper cache profiling, which I skipped out on implementing as I saw that perf stat event names are different for certain CPU microarchitectures, eg: AMD Zen.
I now learn that I should have been doing alignment that matches the register width instead of blindly 64B. Which shortly came to the realization that I would have to account for AVX2s' 256 bit registers and NEON's 128 bit registers and handle value packing accordingly. Thus contributing to my understanding of why deterministic environments are so important... you do not have to stretch efforts thin trying to account for everything.
The goal here was that I wanted to eliminate memory fragmentation and minimize allocation overhead.
Next, we will go into how we can leverage our CPUs efficiently when processing data.
Maximizing Your CPU Using SIMD
SIMD Instruction sets are a powerful optimization technique often see in performance-critical systems built by companies like Meta, Netflix, and frameworks like Meta's PyTorch. SIMD stands for Single Instruction, Multiple Data, a model where a single CPU instruction process multiple data points simultaneously. This becomes ideal for workloads involving repetitive operations on large data sets, such as numerical simulations (Monte Carlo), ML inference, or signal processing.
The SIMD instruction sets I worked with includes:
- AVX2 – 256-bit registers; broadly supported across Intel and AMD CPUs.
- NEON – 128-bit registers used on Apple Silicon (ARM)
There is also AVX512, which employs 512-bit registers but is limited to Intel CPUs at the time of writing this. Thus I chose AVX2 for maximum compatibility across x86_64 architectures as well as NEON for Apple M-series CPU support.
For example, instead of looping to add values from two arrays, SIMD lets us do this in parallel, which reduces the instruction count and boosts throughput simultaneously.
for (int i = 0; i < 4; ++i) {
    results[i] = array_1[i] + array_2[i];
}
Latency: ~16 CPU Cycles
Can be done in one go:
#include <immintrin.h>

__m256 results = _mm256_add_ps(array_1, array_2);
Latency: ~3 CPU Cycles
( Note: these are AVX2 intrinsics, for the entire blog post, AVX2 intrinsics are used here )
Allowing us to add 4 doubles together all at once. Note that we use 256 bit intrinsics as we are adding in batches of 4s and C++ doubles are 64 bits and \( 4 x 64= 256\) , thus 256 bit wide registers are used here. Furthermore, additional logic is needed to handle left over work that cannot be batched. The approach here is rather simple as you just need to find \(leftover = n % batch_size \), and then process the main portion using SIMD. Then use a scalar loop to process the remaining \( leftover \) elements one at a time:
#include <random>
#include <immintrin.h>

// Random number generator engine for our Xs & Ys
thread_local std::mt19937_64 engine(std::random_device{}());
std::uniform_real_distribution<double> dist(0.0, 1.0);

int loopEnd = numberOfTrials - (numberOfTrials % batch);

for (int i = 0; i < loopEnd; i += batch) {
    for (int j = 0; j < batch; ++j) {
        randX[j] = dist(engine);
        randY[j] = dist(engine);
    }

    __m256d dartX = _mm256_load_pd(randX);
    __m256d dartY = _mm256_load_pd(randY);

    *hits += countInsideCircle_AVX(dartX, dartY);
}

// Clean up remainders
for (int i = loopEnd; i < numberOfTrials; ++i) {
    double x = dist(engine);
    double y = dist(engine);
    if (x * x + y * y <= 1.0) (*hits)++;
}
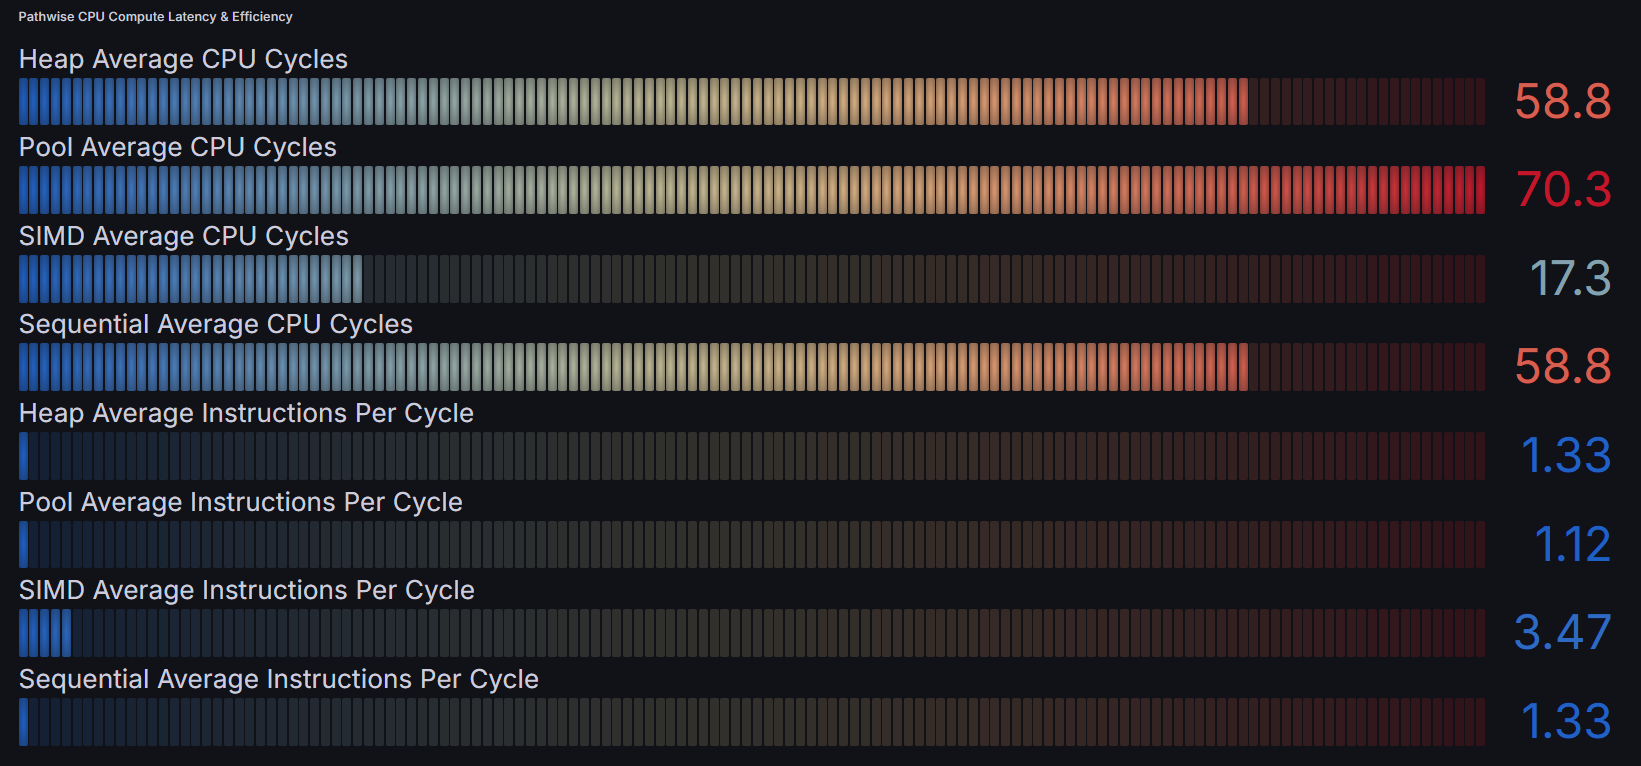
The results were astronomical, our wall time profile shows that SIMD led to 10x efficiency compared to the sequential approach and ~3x faster than our multi-threaded approaches. While for IPC (Instructions Per Cycle), SIMD is churning out ~3.5 IPC while on average other methods are at ~1.3 IPC.
For those curious countInsideCircle_AVX(dartX, dartY) was a bitmask approach that I applied here to count hits in a batch of dart throws. In the next section, I will explain what bitmasking is and how it can be applied, then further optimized with SIMD aware programming.
Who is Bitmask and What's Under the Mask?
Bitmasking is a technique that uses bits (binary numbers) to represent and alter combinations, sets, or states. If you have competitive programming experience or you are deep into the Leetcode rabbithole, you may have heard or know what I'm talking about.
For the uninitiated, each bit in a number represents some variation of "true or false", "included or not", etc... Say we have 4 darts and all darts except the last one was a hit, we would represent it like so: 0b1110. Similarly for only the 2nd dart landing: 0b0100. Suppose we have 2 "vectors" of size 4, dartX and dartY where (dartX[i], dartY[i]) represents a dart, where \( 0 \le i < 4\). Note that the actual types of `dartX` and `dartY` are __m256d, a 256-bit vector containing 4 64 bit doubles.
Instead of having to check whether each dart is a hit individually, you've guessed it, we can batch compute this using SIMD.
#include <immintrin.h>

inline int countInsideCircle_AVX(__m256d x, __m256d y) {
    __m256d x2 = _mm256_mul_pd(x, x);
    __m256d y2 = _mm256_mul_pd(y, y);
    __m256d dist2 = _mm256_add_pd(x2, y2);
    __m256d ones = _mm256_set1_pd(1.0);
    __m256d cmp = _mm256_cmp_pd(dist2, ones, _CMP_LE_OQ);
    return __builtin_popcount(_mm256_movemask_pd(cmp));
}
For each batch, we call countInsideCircle_AVX(dartX, dartY) which does the vectorized equivalent of:
\[ x^2 + y^2 \le 1.0 \]
Where _mm256_mul_pd(x,x) and _mm_256_mul_pd(y,y) does the squaring, _mm256_add_pd(x2, y2) handles addition (ultimately becoming our 4 distances), and __m256_set1_pd(1.0) initializes a 256-bit vector of 4 double values, each set to 1.0.
Then _mm256_cmp_pd(dist2, ones, _CMP_LE_OQ) is a vectorized comparison between the squared distances and 1.0 threshhold. _CMP_LE_OQ is a flag that means: "less than or equal, ordered, non-signaling"
- "Ordered": return true only if neither operand is NaN
- "Non-signaling": No floating point exceptions will be raised on NaN values.
This makes it safe for floating point operations, especially encountering a NaN mid-batch could cause faults or undefined behavior.
So then cmp returns 4 elements that are either true or false based, then mm256movemask_pd(cmp) creates a 4 bit integer representing our vectorized comparison results. For example: 0b1111 means all of our darts were a hit for that batch. Then builtin_popcount(...) is a highly optimized built in GCC/Clang function that counts how many 1-bits are in that 4-bit integer. For example __builtin_popcount(0b0101) = 2 . Then the function ends with the returned amount of hits from out popcount call.
The tradtional scalar approach would take ~50-120 CPU cycles:
for (int i = 0; i < 4; ++i) {
  if ( (dartX[i] * dartX[i] + dartY[i] * dartY[i]) <= 1.0) ) {
    hits++;
  }
}
While our SIMD + bitmask approach takes a mere ~6-7 CPU cycles, meaning we get a ~8-17x speed up.
Pre-allocated memory, bump allocators, SIMD instruction sets, and bitmasking were the main optimizations I wanted to go in depth about. The next section covers the other optimizations method employed throughout this project.
Other Optimizations
Multi Threading
As I was building the multi-threading infra, I decided that each thread should get its own pseudo random number generator (std::mt19937_64) thus ensuring thread safetiness. For simulations using a bump allocator (SIMD & Pool), I decided to experiment by assigning each thread its own memory pool. This helps avoid false sharing, where two threads may end up accidentally modifying the same cache line, leading to cache contention and reduction in performance.
Data Handling
I opted to use Parquet over CSV as the main file type due its columnar storage and better compression rates. This significantly reduced disk footprint (especially since I had a 1000
From my past experience working with data frames, mostly building factor and machine learning models for my university's student managed investment fund, Beach Investment Group, I chose to use Polars instead of Pandas. Polars is built in Rust and also leverages columnar data storage while Python is row based and uses C but mostly single-threaded. Polars leverages SIMD and multi-threaded execution as well as being strictly typed, reducing the chances of silent bugs. Thus Polars is not only safer but it is also much faster than using Pandas for large scale data.
To monitor everything, I plugged into Grafana’s native support for real-time dashboards. With Grafana hooked into my telemetry stack, I could see trial throughput, ingestion latency, and system bottlenecks live — making it dead simple to catch slowdowns or backpressure as simulations scaled up.
This aligns with one of my core engineering principles: setup should be frictionless, so we can focus on production, not plumbing. In the next section, you'll see the journey that brought this all together.
This aligns with one of my core engineering principles: setup should be frictionless, so we can focus on production, not plumbing. In the next section, I’ll walk you through more of my thought process and decision-making as a systems-focused Software Engineer.
Experience During Working on This Project
How do I Know What to Benchmark?
I could have just blindly ran perf stats with a bunch of random events, however this would defeat the point of benchmarking. The goal isn't to flood my terminal and data with metrics, it was to extract meaningful and actionable insight.
I wanted to exactly understand where the bottlenecks truly were, so we can start identifying what exactly needs to be optimized. Since I was working with a bump allocator and SIMD instruction sets, I knew that cache miss rates and instruction throughput was going to be on the list. Meaning that I tailored my `perf` to target specifics like:
- "Is my bump allocator actually improving L1 cache locality, or just shifting the cost to L2 / L3 / Ram?"
- "How effective is SIMD vectorization in terms of IPC and CPU cycle reduction compared to other simulation methods"
- "Am I triggering excessive TLB miss rates, and which methods are the culprit?
Asking these questions allowed me to understand what kind of results do I want, whether these results are being shown, and what can we fix?
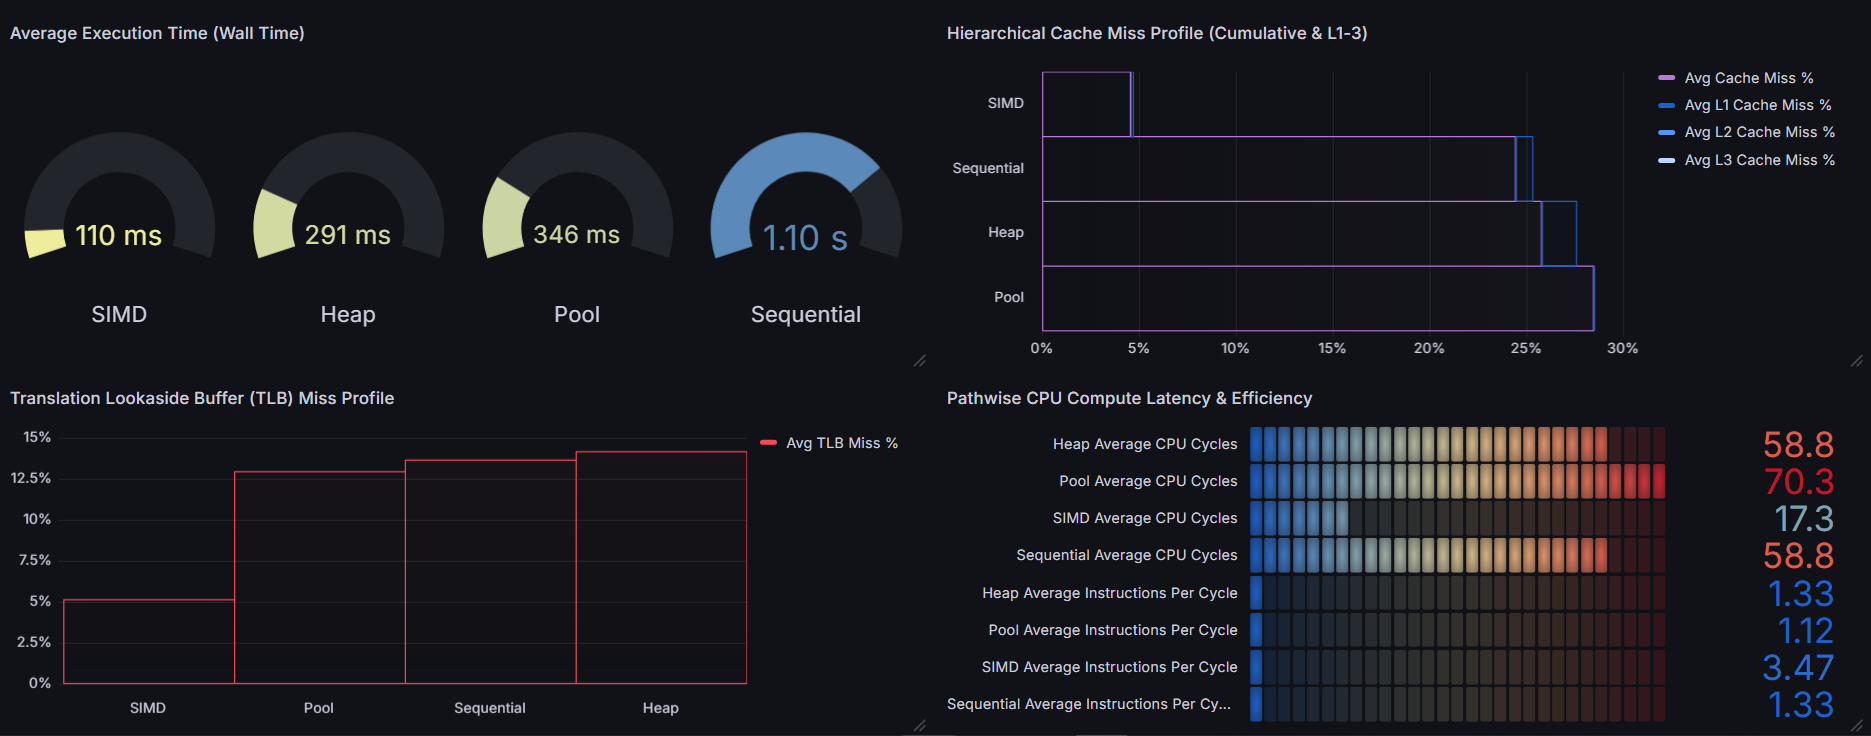
As previously mentioned, I saw that the bump allocator had the highest cache miss rates despite reporting very low L1 cache miss rates. This led me to the conclusion that there was there was something deeper going on down the cache hierarchy.
I started asking myself: "Is L1 cache being used effectively here... or is the cache miss rate masking a massive problem downstream?"
Turns out, the L1 cache was being overloaded with individually aligned allocations. Each 8-byte double was burning an entire 64-byte cache line, causing rapid evictions. So while L1 looked clean, the spillover into L2, L3, & Ram was brutal.
What appeared to be tight caching behavior was actually just wasting cache lines, inflating downstream pressure, and degrading overall performance.
From there, I figured out the bottle neck for such a high cache miss rate was simply due to the bump allocator wasting entire cache lines, inflating downstream pressure, and degrading overall performance.
My Motherboard Fried and I Got Sidetracked Ricing Linux
Yes, you read that correctly, my motherboard got fried and it was from a rogue power surge coming from a damaged microphone USB cable. This ended setting me back about 2 days of work and roughly $300. When I was finished nearly assembling my computer from scratch, I was so excited when my computer booted up.
Then, hold up! My Linux (Arch btw) dual boot load was gone, I knew that my Linux partition was still on my SDD, so it was simply a matter of recovering it. I found my USB stick that was originally used to install Linux, then booted into the ISO. I remounted everything and setup Grub to be my priority boot manager instead of Windows. For those not familiar, a boot manager is a program that manages which operating system to load when your computer starts up. And Grub essentially just gives you the option between wanting to load between different kernels, in this case it was Linux & Windows 10.
Throughout the project, I needed to take breaks. After all, I was spending nearly 8 hours a day working on this project and I ended up getting minimal sleep. How did I spend my breaks? It was mostly either Judo practice or just ricing Linux. Ricing is simply a term for customization of your operating system.
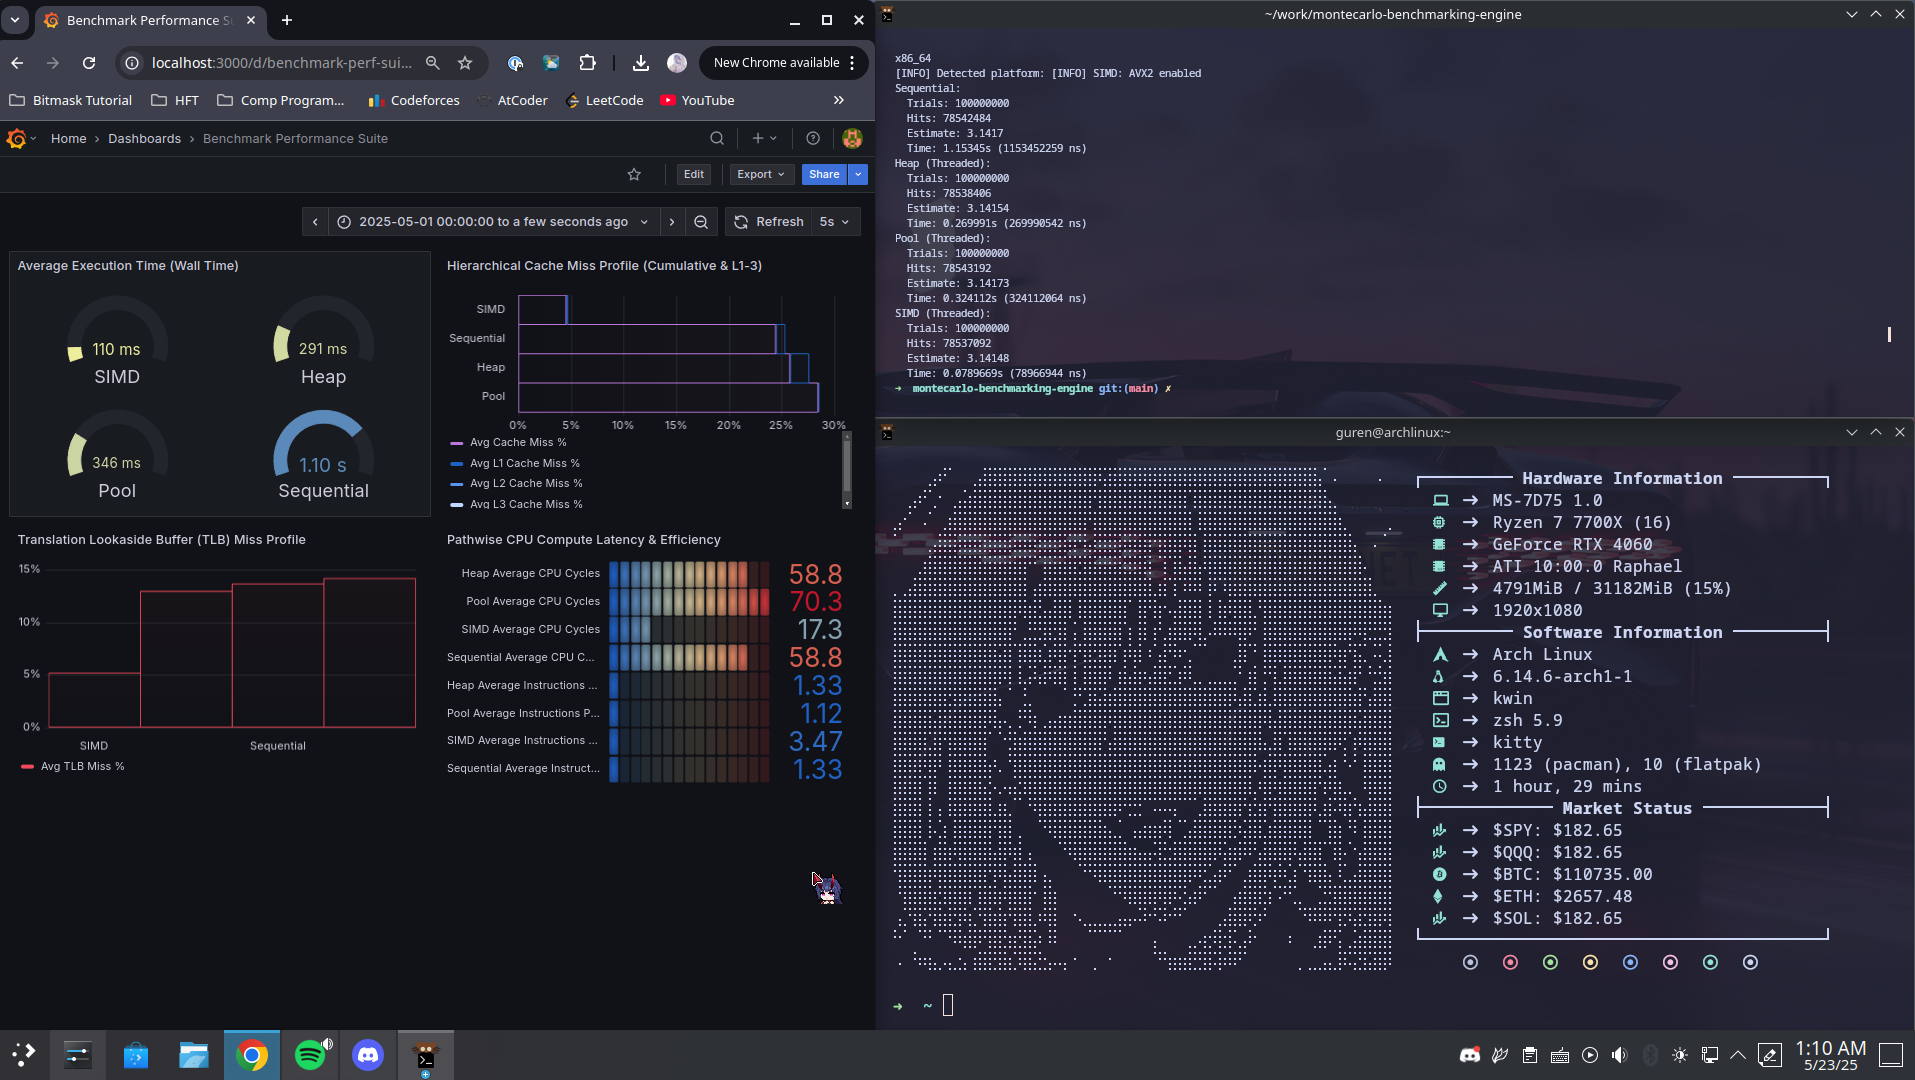
You might be wondering why I included a riced Linux screenshot in a blog post meant for professionals. The truth is this part of the project taught me more about real-world debugging than I expected.
After setting up my Arch Linux environment and customizing it to fit my terminal workflow (yes, including real-time crypto prices and themed Neofetch), I started running into bizarre issues. Electron apps like Chrome and Discord would segfault seemingly at random. I suspected KDE Wayland, then switched to KDE X11. Still crashed.
After hours of trial and error, I finally traced the issue to something hilariously mundane: a custom cursor theme I’d installed. Clicking on images would cause Chrome to crash outright. Reverting to the default cursor instantly resolved it.
What began as a visual tweak turned into a full systems-level debugging arc. It reminded me that even small user-space changes can have deep impacts — and that terminal fluency, curiosity, and persistence are often your best tools.
Cross Platform Support & DevOps Pains
I quickly learned that building for cross platform support is a massive nightmare as you have to account for each machine's nuances. Windows itself did not support aligned_alloc and I soon realized that I would have to refactor my code base to support native Windows environments. Now doing it just once would be okay, but I thought that in the future as I add on more features, this could quickly become a huge time block. I decided that instead of just trying to account for every single variable, I would simply just build for Unix environments and have Windows users use WSL (Windows Subsystem for Linux) instead. This gave me deterministic build environments and I can just focus on purely getting the work done. Yes, I could have used Docker as a build environment but this added a bit of latency to the simulations and Docker had different nuances regarding memory control. I did not want to touch that with a 40-ft stick, so I stuck to not using Docker for building.
Then came the DevOps nightmare, from setting up yaml files, configuring docker environments, to setting up Sphinx & Doxygen along with a custom theme for ultra-clean documentation. I found that setting up toolchains to interact with each other smoothly to be yak-shaving. Where we have to do seemingly endless amounts of small tasks just to achieve a bigger goal. An example would be that I started with Doxygen for documentation, however the default theme looked like it was built in 2003. Then came installing Doxygen Awesome CSS, which worked fine, until I had to spend time fixing CSS rendering that appeared because you changed the background image. Next was trying to get Python doc strings to show up, then installing a whole Sphinx bridge just for it to not work as intended. I decided to go back and learn how to properly format Python doc strings so it's rendered correctly in your documentation. Then I remembered my CSS issue never really went away no matter how hard I tried to tinker. I decided to just stick with Doxygen only and that I went through all this trouble for aesthetic documentation just to go back to a slightly modified default theme.
Foreword
This project demanded everything from me — from late-night perf battles and cache alignment detective work, to motherboard meltdowns and a rogue Linux cursor theme that nearly drove me insane. But through every setback and rabbit hole, I walked away with sharper instincts, a deeper respect for low-level systems, and a reminder of how much I love building things that push limits.
It taught me more than just low-latency optimization. I learned the value of deterministic environments, the hidden cost of DevOps friction, how fixing one bug often births another, and how Linux ricing can spiral into an unexpected masterclass in debugging.
Most importantly, it reconnected me with the joy I had back in high school, reverse engineering sneaker bots, bypassing anti-bot systems, and chasing that next technical challenge just because I could.
I'm immensely glad that I started and finished this project front to back. But even more than that, I'm grateful for the chaos, the depth, and the growth that came with it.
I'll see you next time, cache you later!
MCBE Project Repo: